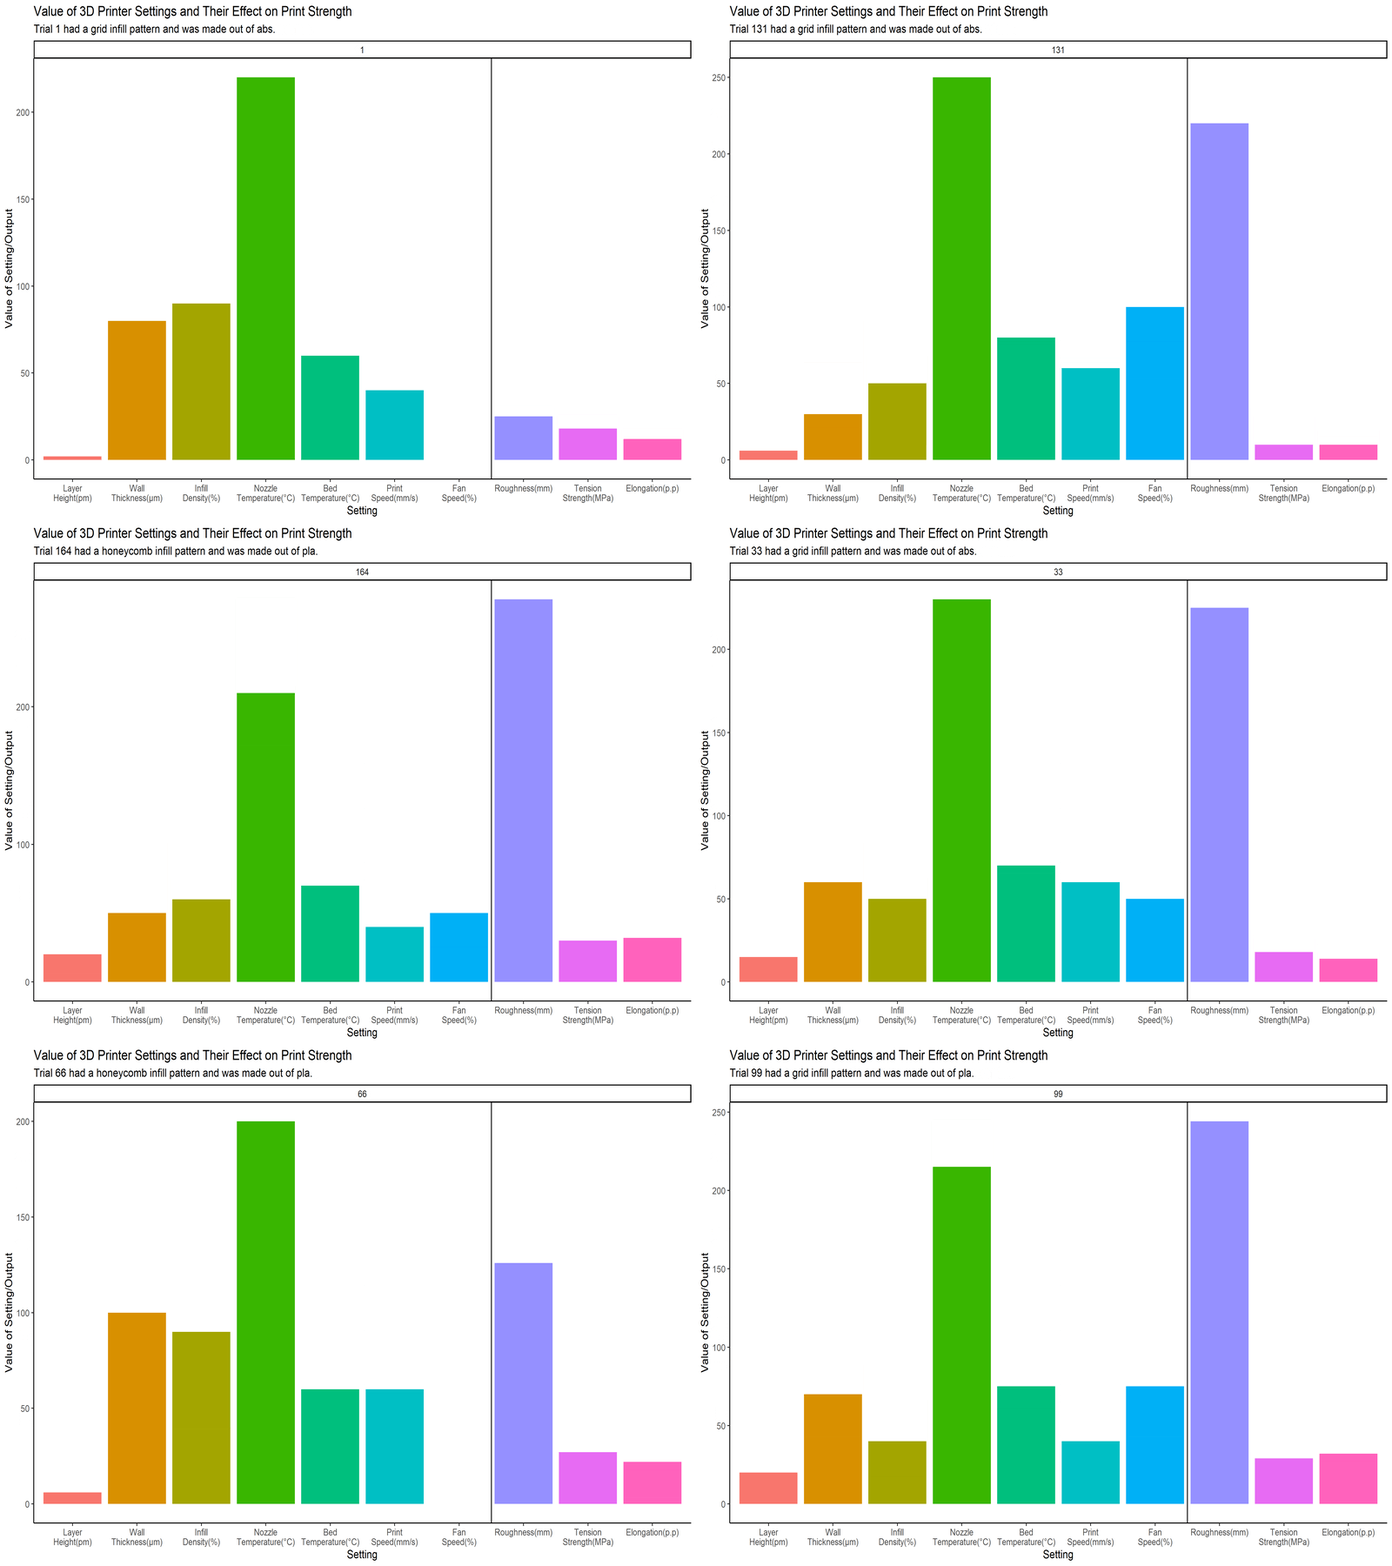
I used data from a 2019 experiment in Selcuk University about using an Ultimake S5 3-D printer that simply did a large number of test prints with different settings and filaments.
Below is an animation of the data and how every setting can create a change in the final product’s strength. Columns to the right of the line are properties of the print while columns to the left are the settings that constructed the print.

We can also look at the data itself.
This makes up the data of my project, and I’ll be going into it in more depth later.
You can find the source of my data here and here.